Extrapolation
When we look at the whole time-series its rather easy to predict the final voltage of the time series, as you can observe here.
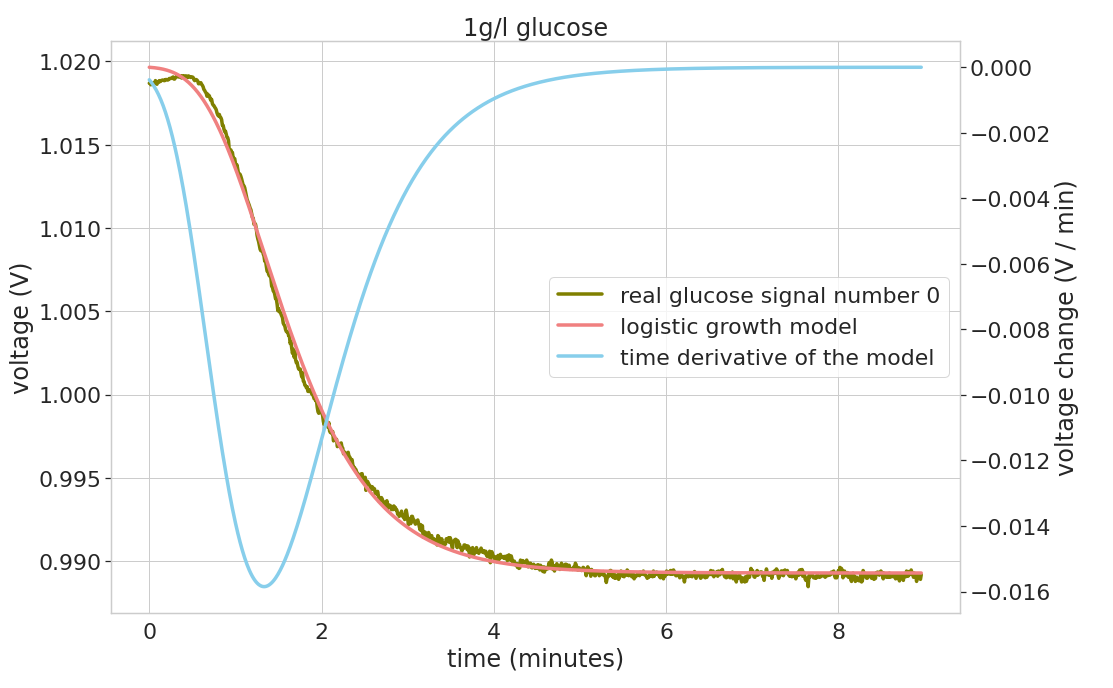
The green curve is the actual measurements of the glucose sensor. The orange curve is a generalized logistics growth model that is fitted to the sensor data.
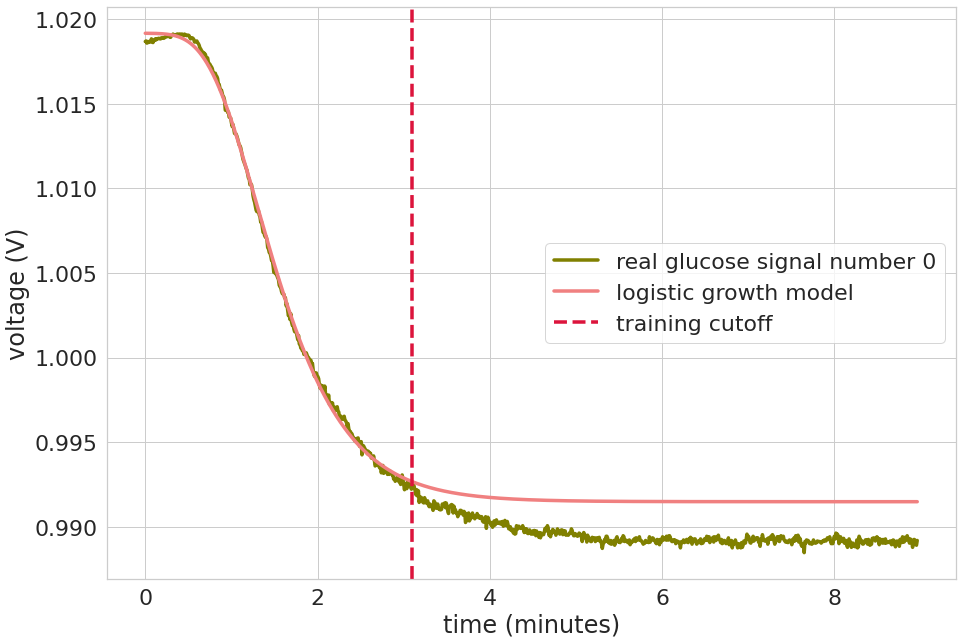
Maximum Likelihood
When we make a cut-off after 3 minutes the fit of the model to the data becomes worse
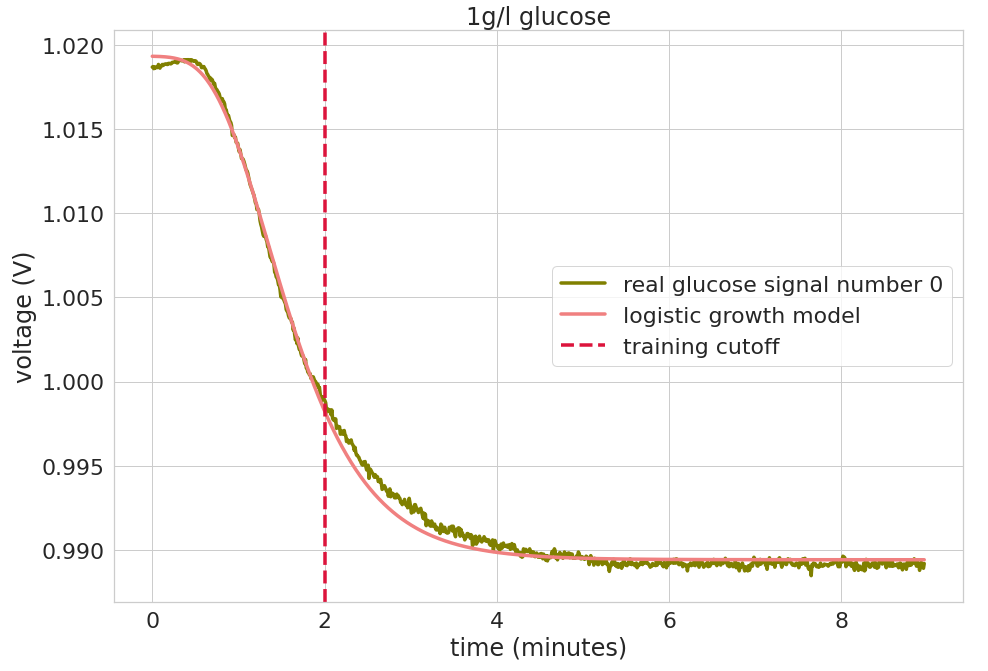
Maximum A Posteriori
When we take gaussian priors into account, we improve the curve fit. In particular we want the lower asymptote to be close to the final signal, as that is our prediction for the final voltage that correlate with the glucose concentration.
When we make a cut-off after 2 minutes the fit of the model to the data improves.